Updated February 2026
I’ve always thought it would be a fun ‘side quest’ in life to walk every street, trail, and park on the planet. So for the past decade I’ve made it my mission to do that. I want to see everything. Some people say it’s impossible to walk 100 million miles in a human lifetime, but why not try? Worst case, I’ll have a lifetime of adventures exploring every corner of the world.
Since starting this mission in 2015, I’ve GPS-tracked 50,000 miles of walking in over 200 cities and dozens of countries, averaging 10-20 miles per day, which keeps me so healthy I’m functionally immortal (I’ll write another post on this). This project will permanently be a work-in-progress.
Logging the data
Rather than opening a tracking app every time I go for a walk, I have my phone configured to track me 24/7 in the background. This means I capture everything, every second of every day. It’s very likely that I’m the only person in the world to track this amount of data at this level.
I often get asked how to do this. No all-in-one app exists for this, so it’s extremely difficult. If you’re committed, below is the system I use, however if you’d like to stay sane I highly recommend just using a fitness tracker like Strava synced to a tool like Citystrides or Wandrer.
- Install Arc (and maybe Arc Mini and Arc Recorder for backup) on your iPhone. These apps have a ML model that classifies the data. Occasionally you’ll have to manually classify data the model can’t sort out.
- Export the JSON data and use a Python script to parse it and strip out everything except walking. You can visualize the data on this website.
- Finally, write Python scripts to consolidate everything, convert the data to GeoJSON, downsample it to reduce file size, and upload it to Mapbox via their API as a dataset. Then convert the data to a tileset and visualize it on a custom map!
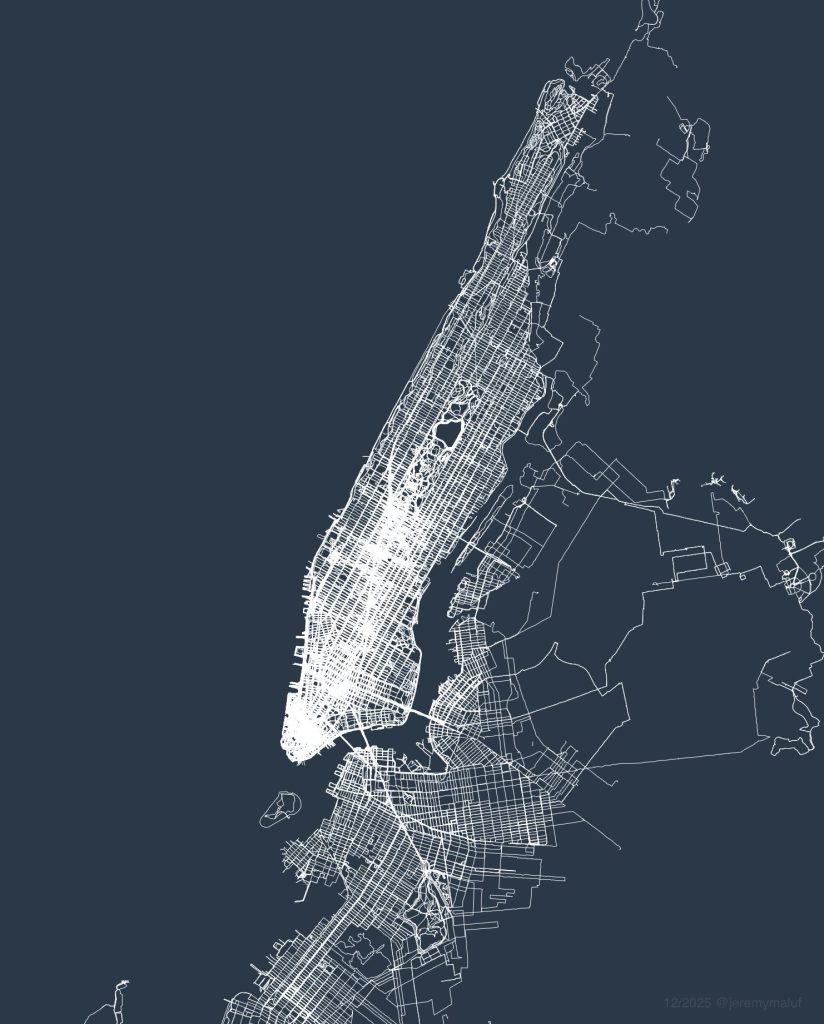
New York City
New York is my favorite city in the world, and because of that it has the most mileage out of the hundreds of cities I’m currently tracking. Since 2015 I’ve walked about 25,000 miles (40,000 km) here, equivalent to a full lap of the planet.
As of December 3rd, 2025, I’ve walked every single street in Manhattan, including the parks, trails, and often both sides of the street. If you count these additional self-imposed rules, I’m the second person ever to do this, and the first person ever to GPS-track it. If you only count streets, I’m around the 50th person to accomplish this (due to it being a popular challenge among runners).
Finishing the rest of the city is going to take some time, however, as Manhattan is the smallest of the five boroughs and still took me a full decade. Though Brooklyn does have some decent progress! If you’d like to stay updated on these long-term side quests, sign up to my newsletter!
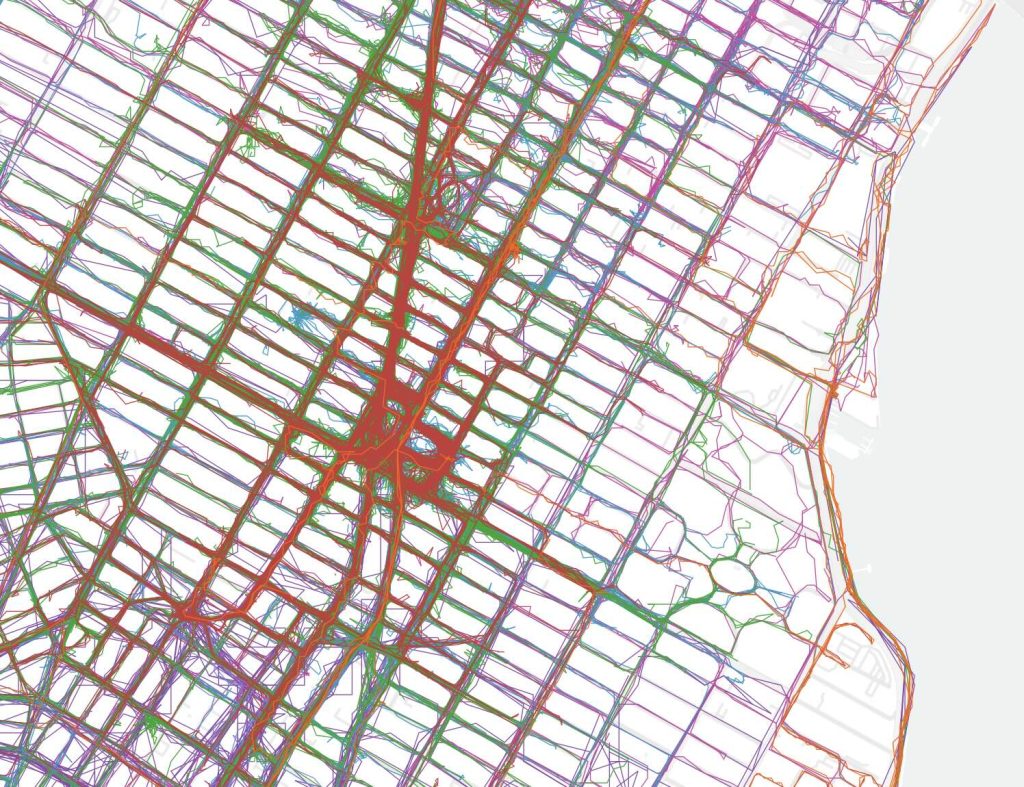
I’m often asked how different this map would look if I tracked my walking but didn’t “seek out” new streets. Humans naturally prefer taking familiar routes, so the answer is very different. It’s hard to see when looking at the map, but walking every street is difficult because the human brain is coded to subconsciously ignore unfamiliar streets. In the thousands of conversations I’ve had about walking during the course of this project, one common discovery is the vast number of people who have never even walked the next street over behind their home. Without checking a map to seek out new streets, even after a decade of living in the city you wouldn’t walk 90% of these streets.
Since most of the data is just me going about my normal life in nyc, like running errands and walking with friends, rather than dedicated walks, it provides a really unique perspective from a geospatial angle about where someone who lives in NYC spends their time. As far as I know, a project like this has never been done before.
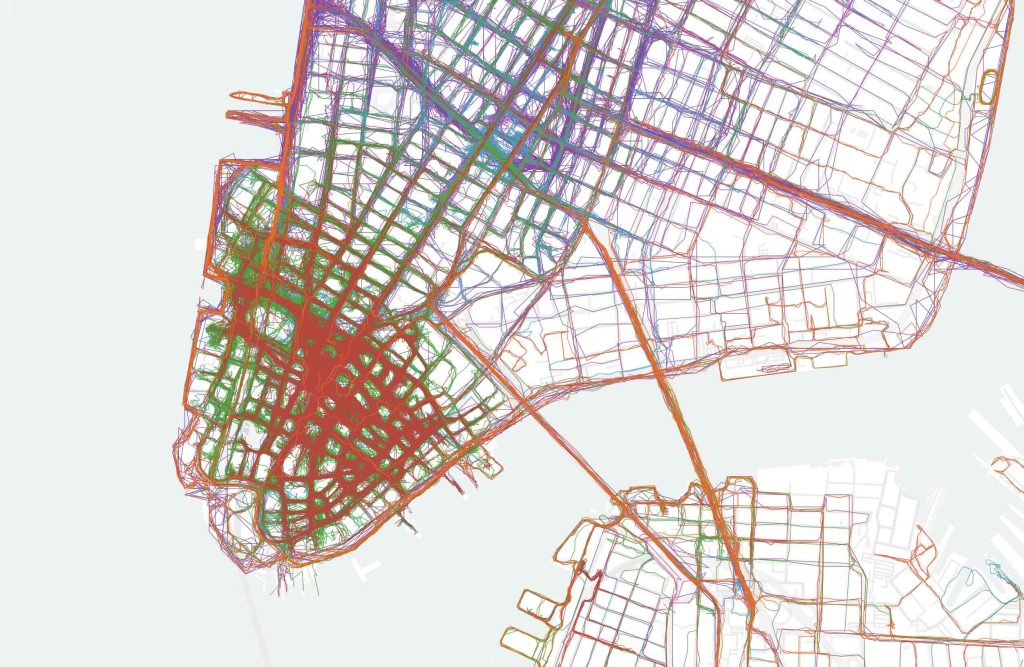
GPS inaccuracies highlight the streets I walk most often, and neighborhoods like the Financial District and Midtown become a dense cluster of lines due to the tall buildings. When I color-code the map you can also see which year I walked the street, for example you can see that I had an apartment in SoHo in 2017-2018 (purple) and that I spent a lot of time in FiDi 2024-2025 (green and red). Fun fact: this is an example of a four-dimensional map.
At the same time, GPS can be so accurate that it will track my movement within large buildings, such as in IKEA or museums. For example, whenever I visit the Met the data shows that I tend to enter via the members entrance, loop through the Temple of Dendur and make a beeline for the sculpture gallery.
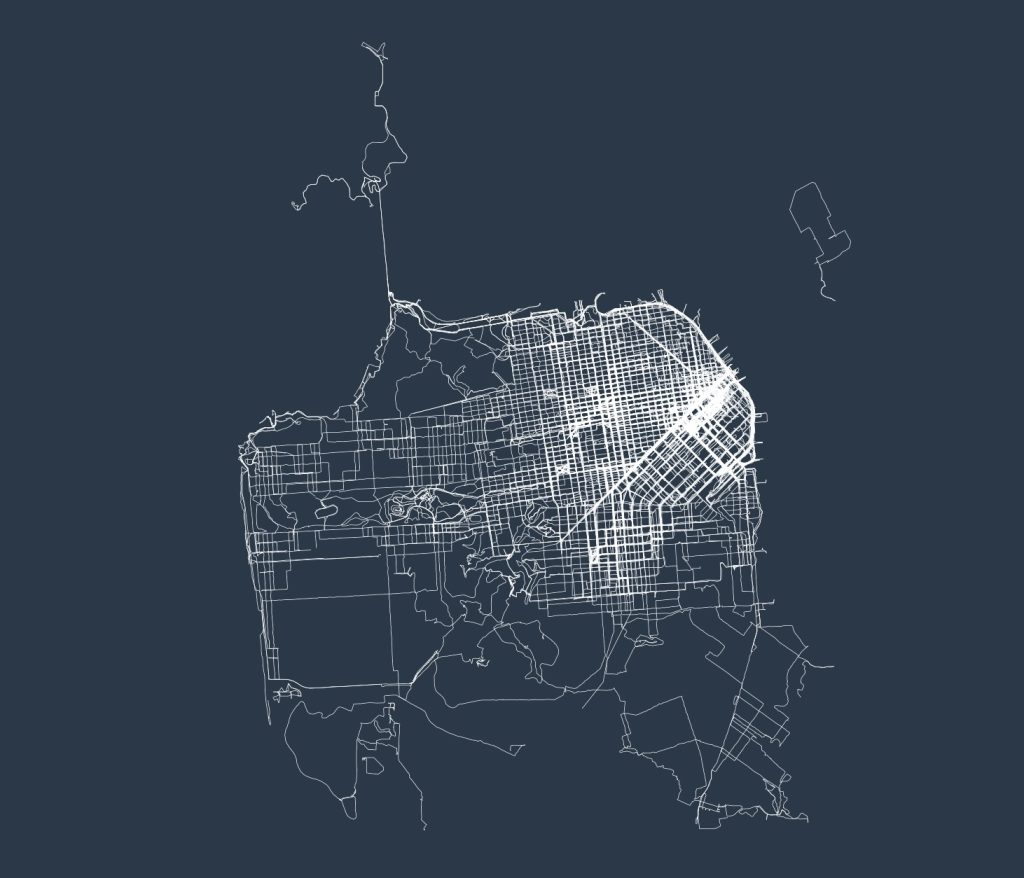
San Francisco
San Francisco is the only major world city that’s close to completion, due to it being a very small city. In total I’ve walked 7,000 miles here, around 75% complete, and I’m about a month from finishing it.
I haven’t found the best way to visualize my Northern California data, since San Francisco is too small of a city to look interesting, but the Bay Area as a whole is too large to see individual streets. I have walked around 15,000 miles in the Bay Area as a whole, mostly around Mountain View and Palo Alto. For now I will omit the full map, as displaying suburbia necessitates censoring addresses.
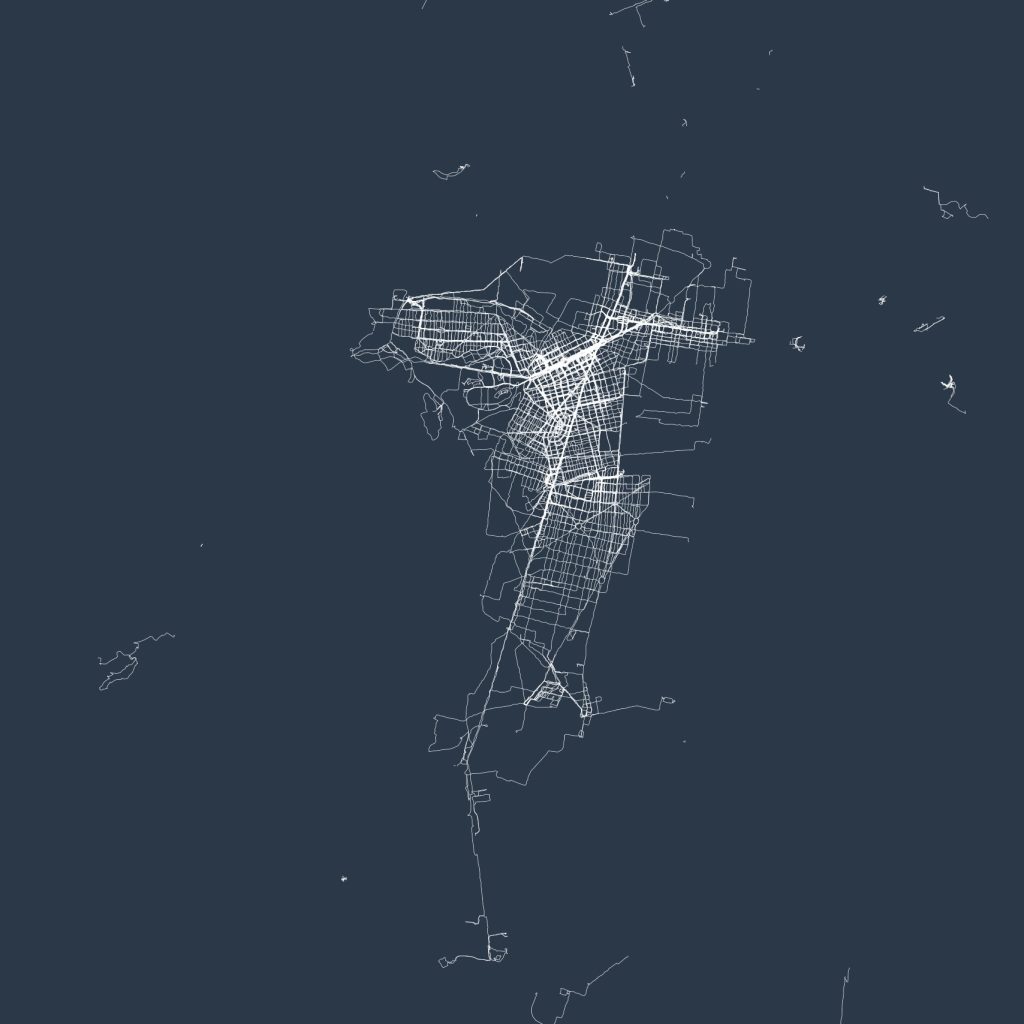
Mexico City
The 2,500 miles I’ve walked in Mexico City barely even puts me at 5% completion, as it’s the largest city in North America. I’ve walked the majority of the developed portion of the city, including all landmarks, with the majority of what’s left being sprawling residential neighborhoods that used to be separate towns and pueblos before being swallowed up by the city. Slowly over time my map will expand outward to cover them.
More cities coming soon…
100% human-written | instagram | twitter | youtube | hi@jeremymaluf.com